
Real-time SPC, from every reading to the wider process
AccuTouch Cloud brings live measurement status, parameter analysis and shop-floor visibility into one connected quality workflow. Deployment, licensing and data interfaces are configured for the application.
- Observe
- Live device and reading status
- Analyse
- Charts, capability and subgroups
- Respond
- Alerts and shared shop-floor views
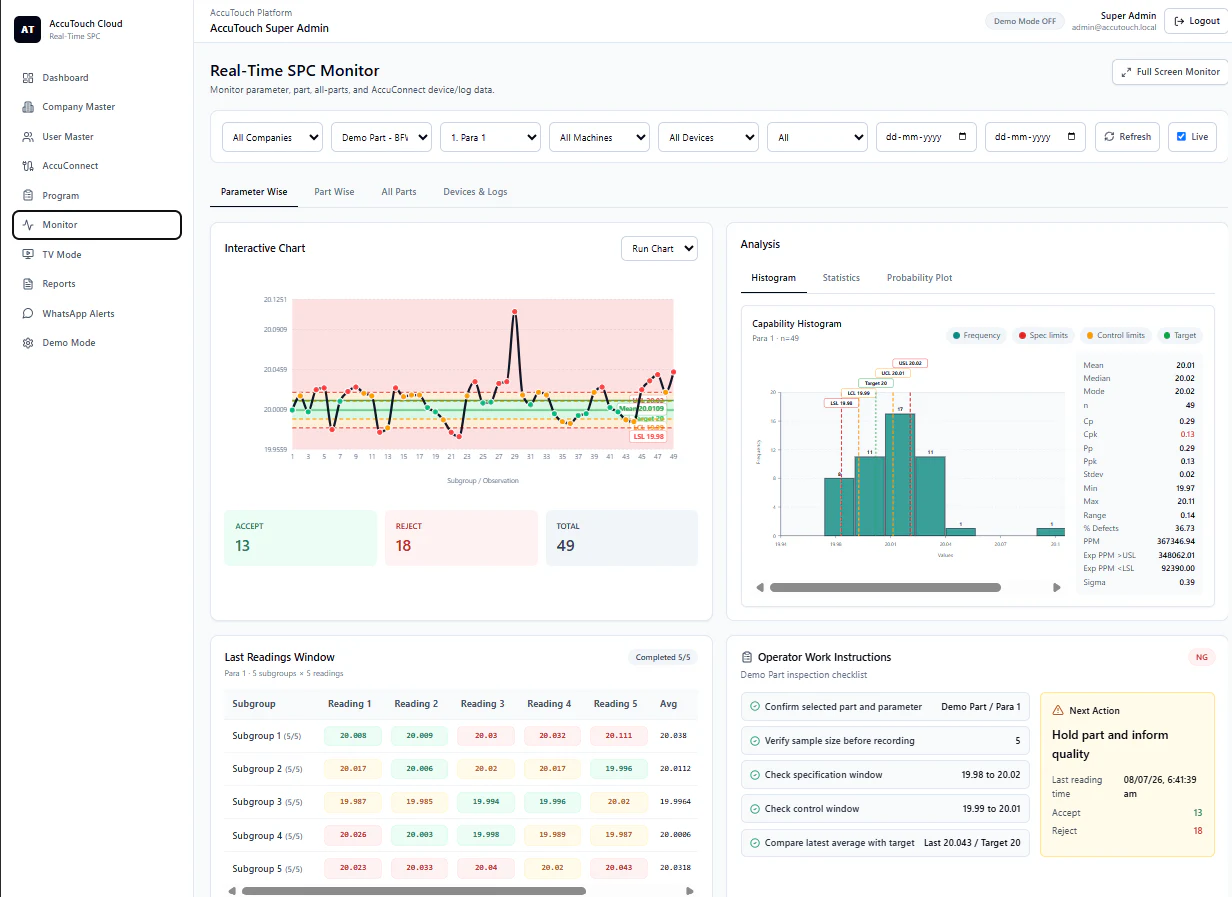
One live view for each decision horizon
Select a view to inspect how information moves from plant overview to parameter analysis and shared display.
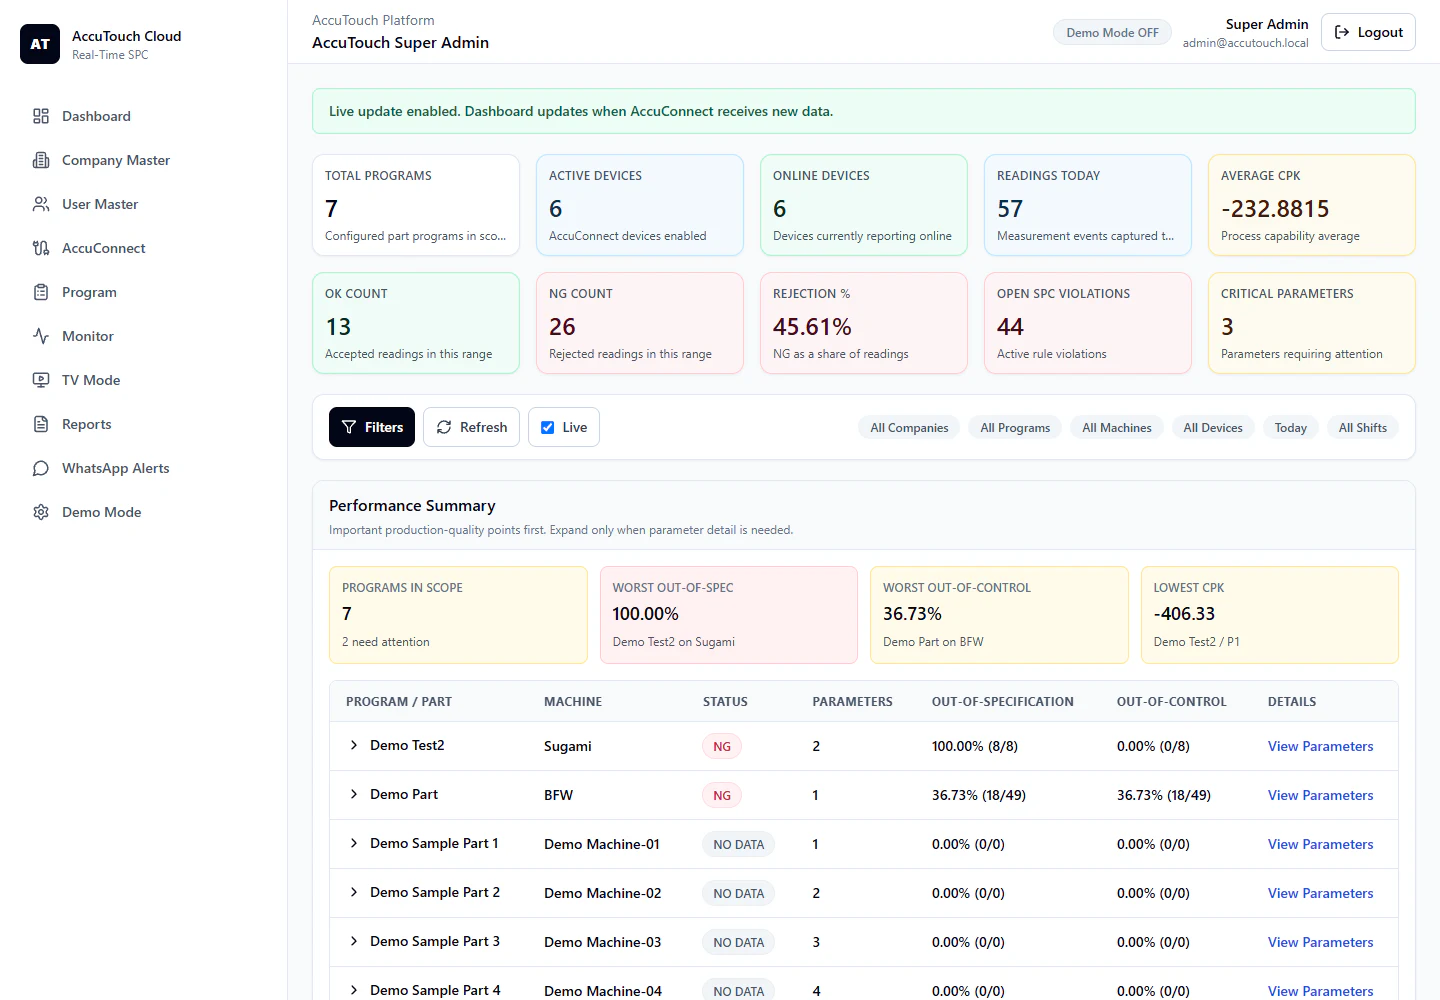
See the quality picture as readings arrive
Monitor programmes, device availability, readings, OK/NG counts, rejection percentage, capability and open SPC violations from one operational overview.
Custom multigauging software for complex measurement stations
The AccuTouch Multibore application brings live dimensional measurement, calibration, traceability, SPC, reporting and machine connectivity into one configurable operator interface.
Contact Admin about a custom application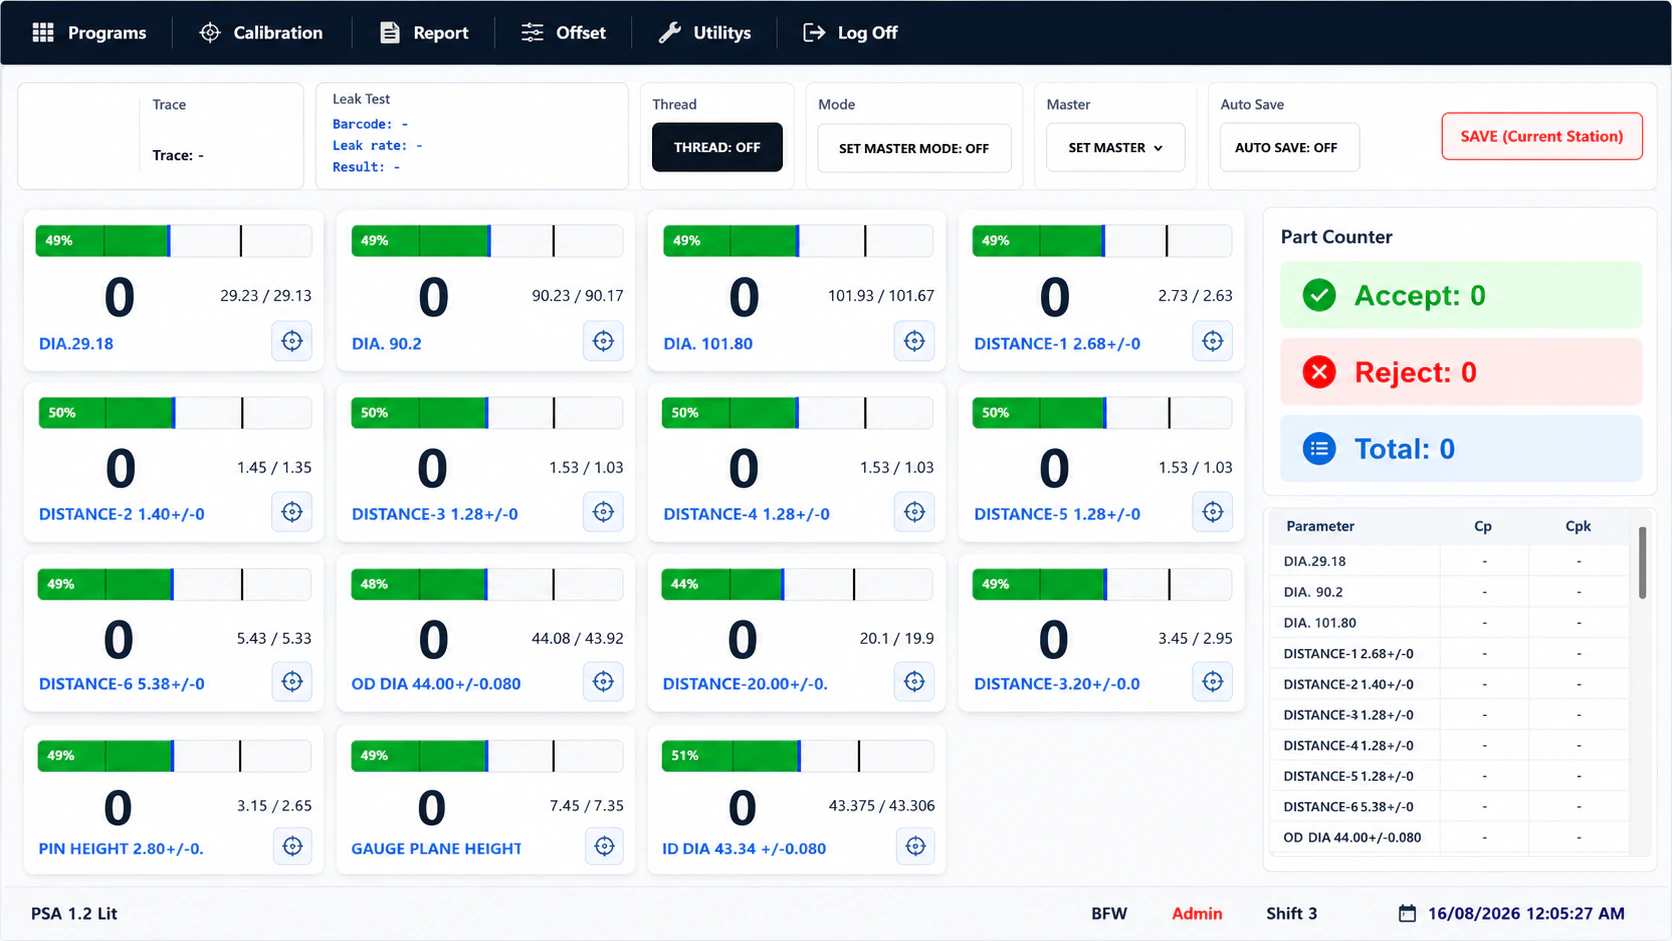
Measurement & calibration
- Live multi-channel dimensional readings with standard, bar graph, label, dial and custom display modes
- Single-parameter or all-parameter calibration, measurement-system configuration and fixture control
- Tolerance, master, iteration, grading and SPC-rule configuration for each measurement parameter
- OK/NG evaluation, rejection-bin handling, Cp/Cpk monitoring and warning alerts
Programs & part setup
- Create, edit, select and duplicate part programmes for different components and gauge fixtures
- Import, export and back up programme definitions for controlled recovery and transfer
- Configure parameters, masters, tolerances and the measurement sequence around the real inspection process
Traceability & access
- Part ID and barcode traceability with shift setup and operator tracking
- User login, fingerprint support, permissions and user-management controls
- Configurable licensing and feature flags for the modules enabled on each station
Reports & statistical analysis
- Reading, consolidated, calibration, offset and event reports
- CSV export filtered by date, shift, user, machine, part, parameter and result status
- Run, X̄-R, X̄-S, I-MR, X, CUSUM and EWMA charts
- Histogram, Pareto, scatter, probability, process capability, Cp/Cpk, heatmap, regression, rejection-rate and yield analysis
Automation & connectivity
- CNC/FANUC status, connectivity and tool-offset reading or writing
- Digital input/output, relay control, configurable serial communication and formatted serial output
- TCP/server communication, automatic air-cut control and low-air handling
- PLC-based leak-test monitoring with barcode, leak rate and pass/fail result
Station operation & lifecycle
- Touchscreen keypad and keyboard, full-screen operation and Raspberry Pi support
- Single-instance protection, application logs, reminders and software updates
- A configurable interface for dedicated multibore and custom multigauging stations
This interface is configurable. Final modules, licensing, hardware interfaces, machine connectivity and report outputs are confirmed for the selected gauge station and production process.
Built for monitoring, analysis and controlled response
Capabilities shown in the supplied software feature list; final availability depends on the configured deployment.
Monitor in real time
- Dashboard for programmes, devices, readings, OK/NG counts, rejection and open violations
- Parameter-wise, part-wise and all-parts monitoring
- AccuConnect device state, incoming events and raw-frame logs
- Full-screen TV display with configurable rotation and critical-alert override
Analyse process behaviour
- Run chart, X̄-R and X̄-S control-chart options
- Capability histogram, statistics and probability-plot analysis
- Latest subgroup readings with average, range and OK/WARNING/NG status
- Out-of-specification, out-of-control and lowest-Cpk performance summary
Configure the operation
- Company, user, programme/part and measurement-parameter management
- Multi-company and role-based access
- Reports and demonstration mode
- Optional WhatsApp alerts require VPS configuration, recipient controls and commissioning
Screens show demonstration data, not production evidence. Exact software modules, hosting, retention, alerting, device interfaces and user roles require configuration confirmation.
Plan the data path around the real process
Share the gauge count, data sources, reporting needs, user roles and required shop-floor visibility.